Puppet agent run reports contain useful metrics, such as the number of resources that were modified or failed to apply, or how much time each step of the run took.
The traditional way of retrieving these metrics is using a report processor on the Puppet master.
Since Prometheus is now a de facto standard in metrics collection, there exists a Prometheus reporter, maintained by the VoxPupuli community. However, it uses a dropzone directory of yaml files with a local node exporter, so it's not a very clean approach.
On top of this, reports and their metrics are already exported to the PuppetDB, which provides its own API to access this data.
Prometheus PuppetDB Exporter
Prometheus PuppetDB Exporter is a simple go binary that can scrape the PuppetDB for report metrics for Prometheus. It runs independently of the Puppet stack, and can be tuned to collect various types of metrics:
- resources
- time
- changes
- events
The exporter provides metrics in the form
puppet_report_<type>
for each of these types.
# HELP puppetdb_exporter_build_info puppetdb exporter build informations
# TYPE puppetdb_exporter_build_info gauge
puppetdb_exporter_build_info{build_date="2019-02-18",commit_sha="XXXXXXXXXX",golang_version="go1.11.4",version="1.0.0"} 1
# HELP puppetdb_node_report_status_count Total count of reports status by type
# TYPE puppetdb_node_report_status_count gauge
puppetdb_node_report_status_count{status="changed"} 1
puppetdb_node_report_status_count{status="failed"} 1
puppetdb_node_report_status_count{status="unchanged"} 1
This makes it fully compatible with Vox Pupuli's reporter implementation.
Deploying
The exporter is provided as a Docker image, and is included by default in Camptocamp's PuppetDB Helm chart.
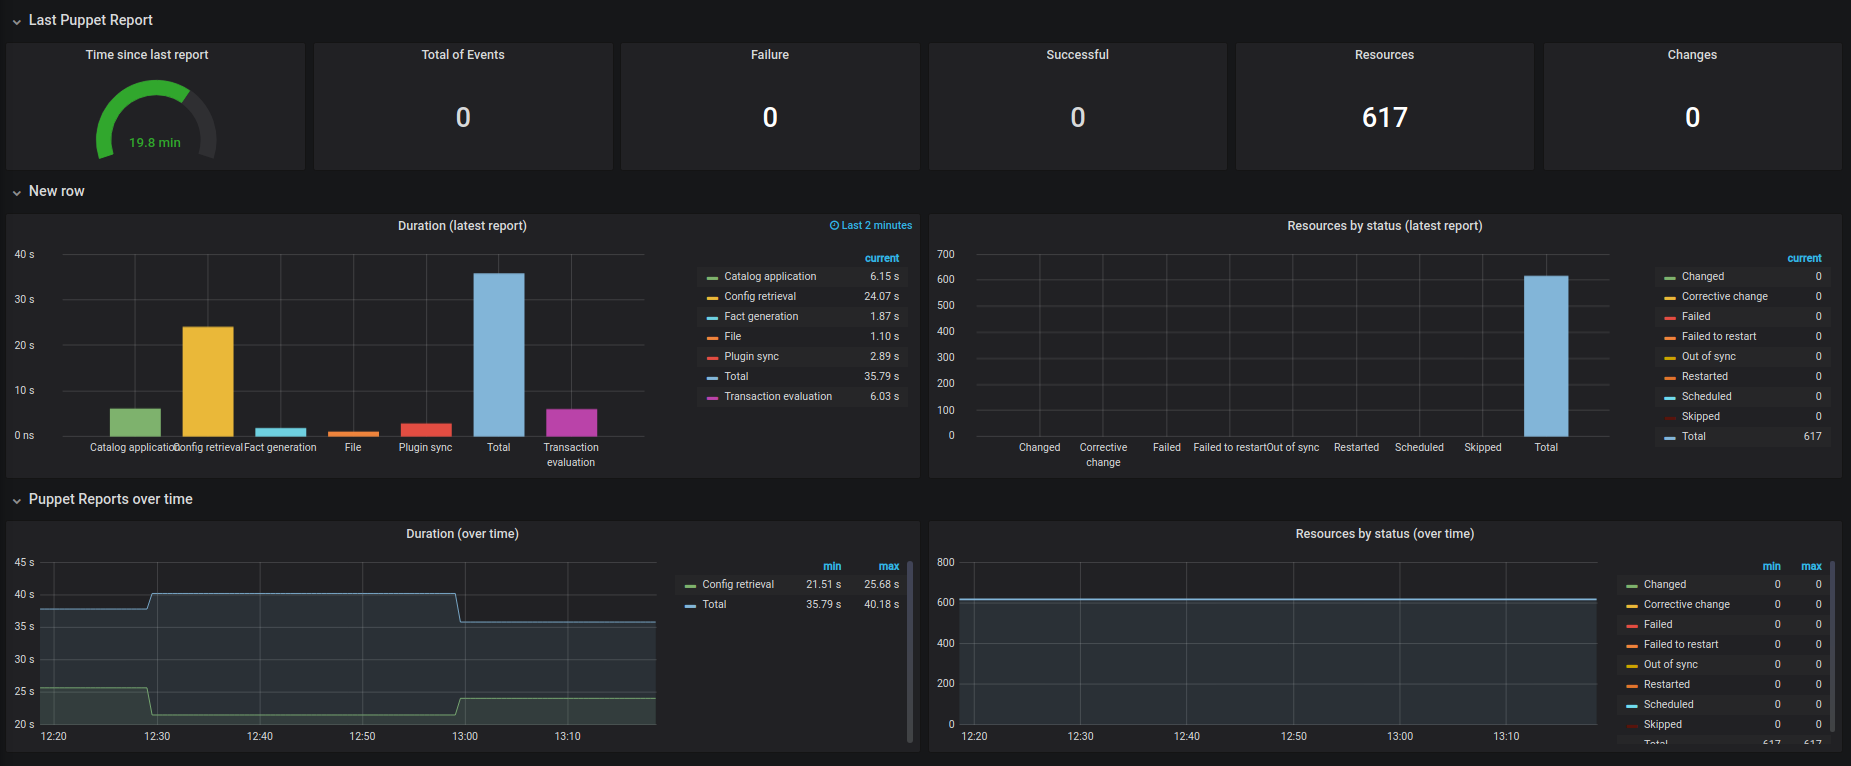
Usage in Grafana
Coupled with (a slightly modified version of) Julien Pivotto's Puppet Report dashboard, you can make some pretty graphs from these metrics: